Explore Health Rankings
1.Go to: www.countyhealthrankings.org
| County Health Rankings & Roadmaps
Community engagement is a key component to advancing health equity. In Allen County, Kansas, a 2017 RWJF Culture of Health Prize-winning community, Thrive Allen County works to improve quality of life by creating conditions for residents to embrace their power and act collectively. |
||
Click the “Explore Health Rankings” tab; click “What and Why We Rank.” The County Health Rankings “Model” consists of Policies & Programs, Health Factors, & Health Outcomes.
- List the four categories of “Health Factors” and include for each, the percent contribution that the category has on overall health.
- For the “Health Outcomes” category, list the two main outcomes that are measured.
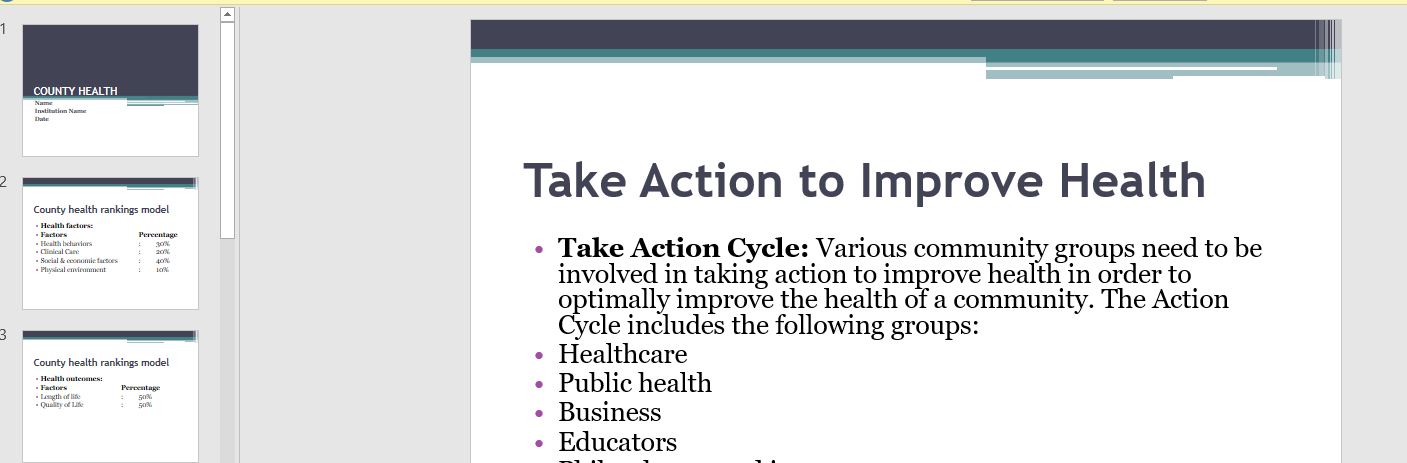
2.Click the “Take Action to Improve Health” tab; scroll down the page, click “Action Cycle, Learn More.” The figure you see is the “Action Cycle;” at the core of the Action Cycle are all of the community groups that need to be engaged to optimally improve the health of the community. List these eight community groups; what group comprises the center core?
3.Scroll back to the top, click the “Explore Health Rankings” tab again; click “Read Our Reports, Learn More.” Click “2018 County Health Rankings Key Findings Report.”
-
- Scroll down to the “Summary of Findings,” list three key findings from the 2018 data (use bullets, and using your own words, be brief).
- Scroll down to the graph entitled “Trends in Low Birthweight, 2006-2016.” What year had the lowest percentage of LBW infants?
- Continue to scroll down to the graph entitled, “Trends in Teen Birth Rates among Racial/Ethnic Groups, 2006-2016.” In 2016, what racial group had the highest Teen Birth Rate? What racial group had the lowest Teen Birth Rate?
4.Scroll back to the top, click the “Explore Health Rankings” tab again; in the “Find County Rankings” box, type in the name of your state. On the “Overall Rankings in Health Outcomes” map on the left, click on your county (or city).
-
- Write your state and county (or city).
- On the left side of the newly loaded page (dark orange highlighted box), in terms of “Health Outcomes Overall Rank,” scroll down the county list and identify and write how many counties are in your state. For “Health Outcomes,” what county ranks the best (Rank 1) and what county ranks the worst (bottom of the list)?
- Within the “Health Outcomes” category in the main data section (gray/blue highlighted box), how does your county rank? For the categories, “Length of Life” and “Quality of Life?” how does your county rank?
- Within the “Health Factors” category (blue highlighted box), how does your county rank? Provide the rankings for the main categories of “Health Behaviors,” “Clinical Care,” “Social & Economic Factors,” and “Physical Environment.”
- .On the same page, scroll back to the top and notice that there is a category for “County Demographics,” click and expand the data (+).
-
- What is the total population in your County and in your State?
- Scroll down to “Health Behaviors.” What is the prevalence of Adult Smoking in your County? What is the prevalence of Adult Smoking in your State? What is the prevalence of Adult Smoking in the Top U.S. Performers?
- Find a category on this page that has a small data “red trend” box in the column. Click on the data “trend” box and describe (using data) what has happened over time for that category for your county, state, and the U.S.
- Find a category that has a small data “green trend” box in the column. Click on the data “trend” box and describe (using data) what has happened over time for that category for your county, state, and the U.S.
6.Scroll to the top of the page, click on the “Take Action to Improve Health” tab; click “What Works for Health.” In the “Find Strategies by Topic” area, click on a topic link that is related to one of the small data trend boxes you explored in question 5 above. On the page, scroll down and browse the examples of the Policies & Programs that are presented.
-
- Choose one of the Policies or Programs that has an “Evidence Rating of Scientifically Supported” on the page; identify the name of the policy/program. Click on that link, read the content, and write 2-3 bullet points to summarize what the intervention does.
- Write one of the “Expected Beneficial Outcomes” of the intervention.
Answer preview:
Words:15 slides