Explain the ‘Quantity Theory of Money’,
Order Topic: Quantity theory of money Instruction:
| Assessment Task: an essay, explained below. The word limit (for Sections 1 and 2 combined) is 2000 words (plus or minus 10%); this limit excludes the bibliography, and do not count any words in the three Charts such as axis labels or legend. |
| Unit Learning Outcomes Assessed:
LO1 – Explain the concepts of equilibrium and disequilibrium in macroeconomic modelling and analysis LO2 – Research macroeconomic issues independently and explain the findings through a portfolio of work LO5 – Evaluate macroeconomic data, trends and policy |
| Specification: You are required to answer the questions in both sections 1 and 2 below; they are based on data downloaded on 2nd Sept 2017 from https://data.worldbank.org/data-catalog/world-development-indicators
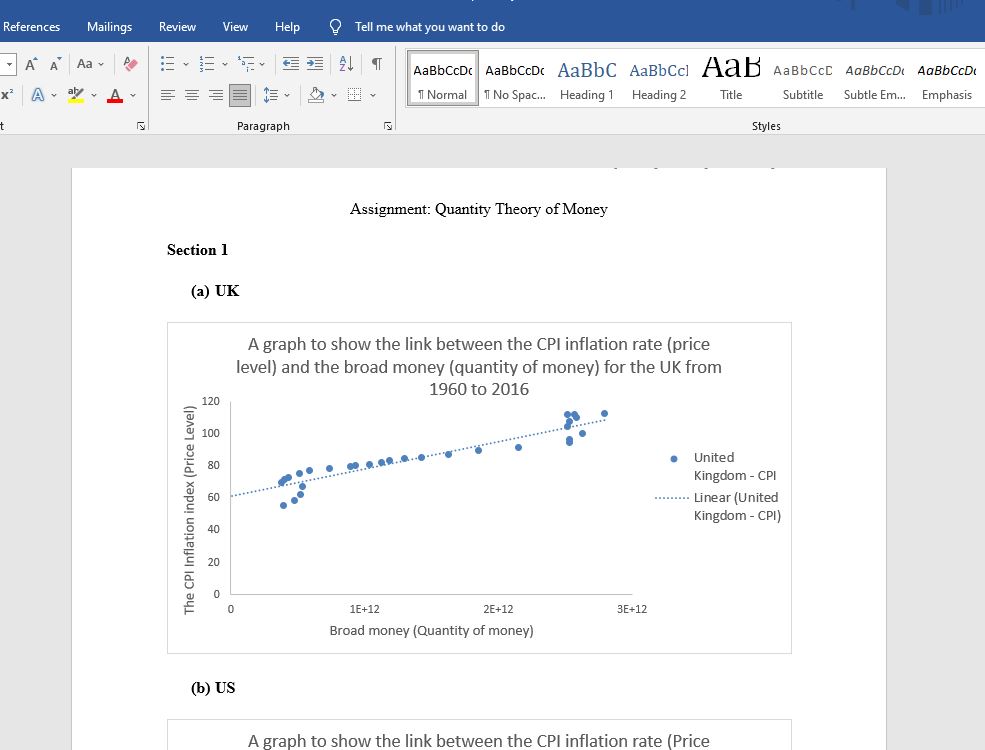
Section 1 (30 marks) ( Graphs have already been done) (a) Use data in the coursework spreadsheet file on Moodle, to produce a chart showing the link between quantity of money (on the horizontal axis), and price level (on the vertical axis), for UK. (b) Use data in the coursework spreadsheet file on Moodle, to produce a similar chart for USA. (c) Use data in the coursework spreadsheet file on Moodle, to make a similar chart for the country allocated to you (in the spreadsheet on Moodle).
Section 2 (70 marks) ( Use Harvard Referencing) Write an essay to answer all three of the following questions: (a) Explain the ‘Quantity Theory of Money’, and explain some recent discussions of this theory in textbooks and/or academic journals. (b) To what extent do your three charts from section 1 support, or reject, the ‘Quantity Theory of Money’? (c) Examine whether available evidence (including your charts) suggests a government can control inflation, by controlling the money supply. |
Answer preview:
Word: 2,300